Blog

  • Energy-Consumption-Dashboard-SQL-Excel

    Energy-Consumption-Dashboard-SQL-Excel

    Take a look at the Energy Consumption Dashboard Video

    Content

    1. Overview
    2. Database ERD
    3. Data Preparation
    4. Data Summarization
    5. Data Visualization

    Overview

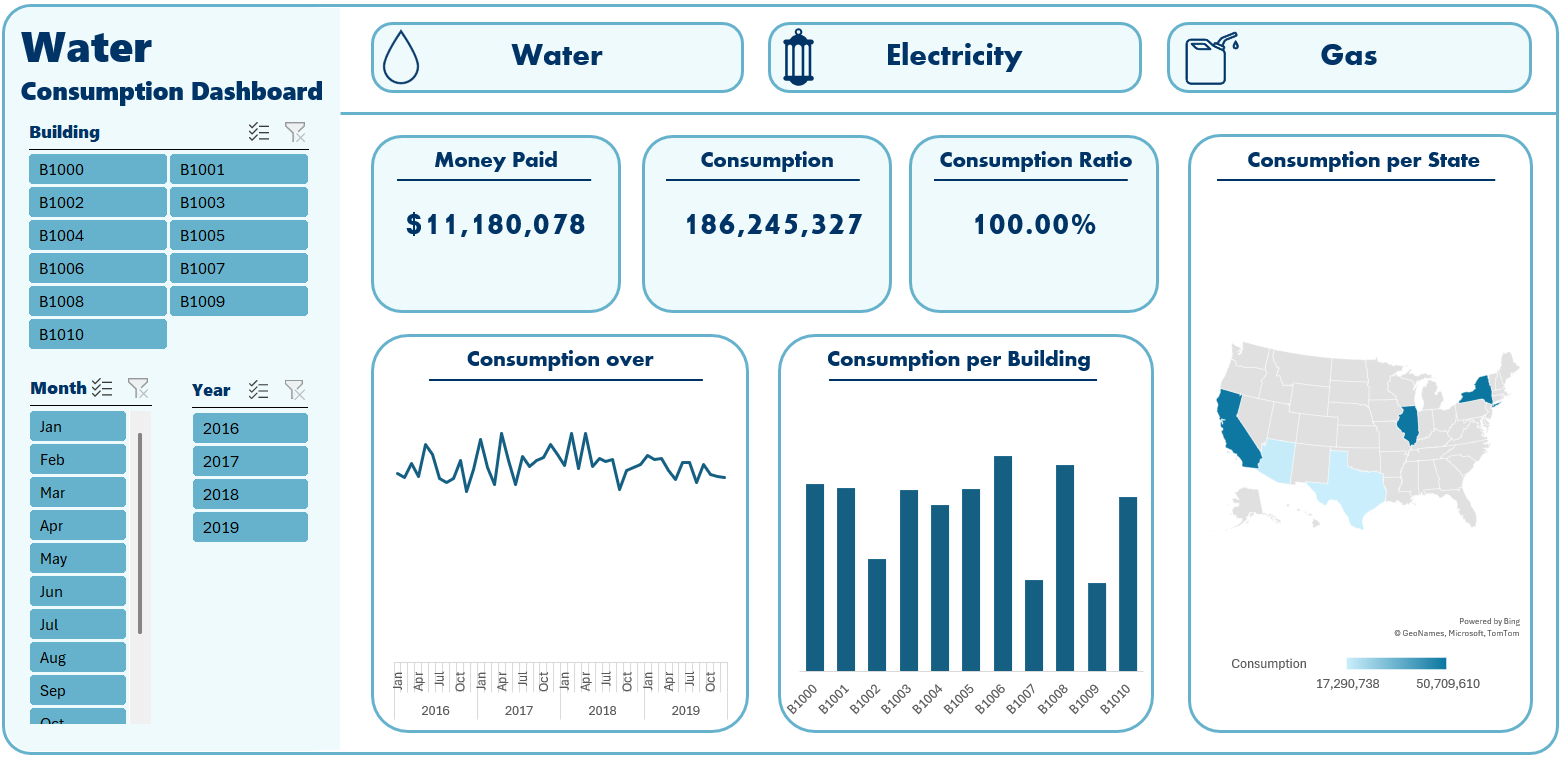
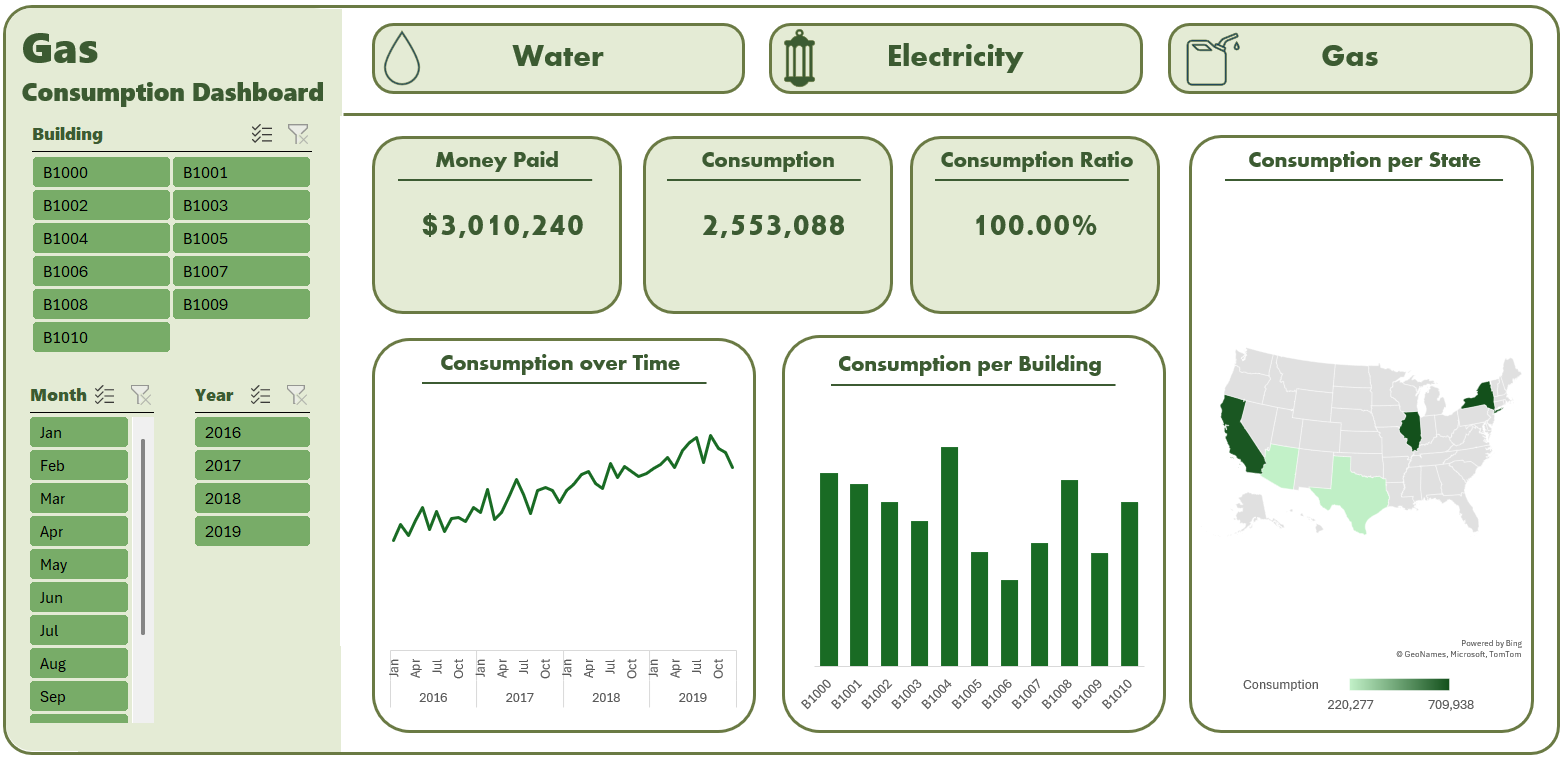
    This is a complete project of creating an interactive dashboard using a combination of the magic of SQL, Excel and Power Pivot. The dataset used is a real world data of the consumption of energy of 11 buildings distributed in 5 states of the USA along 4 years (2016-2019). The goal was creating a dashboard that shows a bunsh of info about the conumption of (Water, Electricity and Gas) of these buildings. The task was to answer some question and draw some charts to visualize and summarize the data:

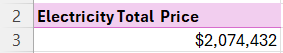
    • What is the total price paid per element?
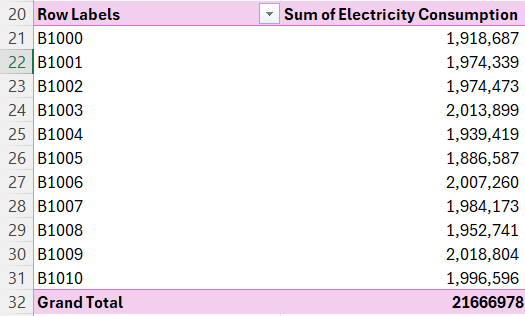
    • What is the total consumption per element?
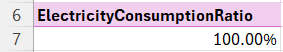
    • What is the ratio of consumption among buildings?
    • A trend line chart of consumption.
    • A column chuart of buildings consumption
    • A map chart of consumption per state

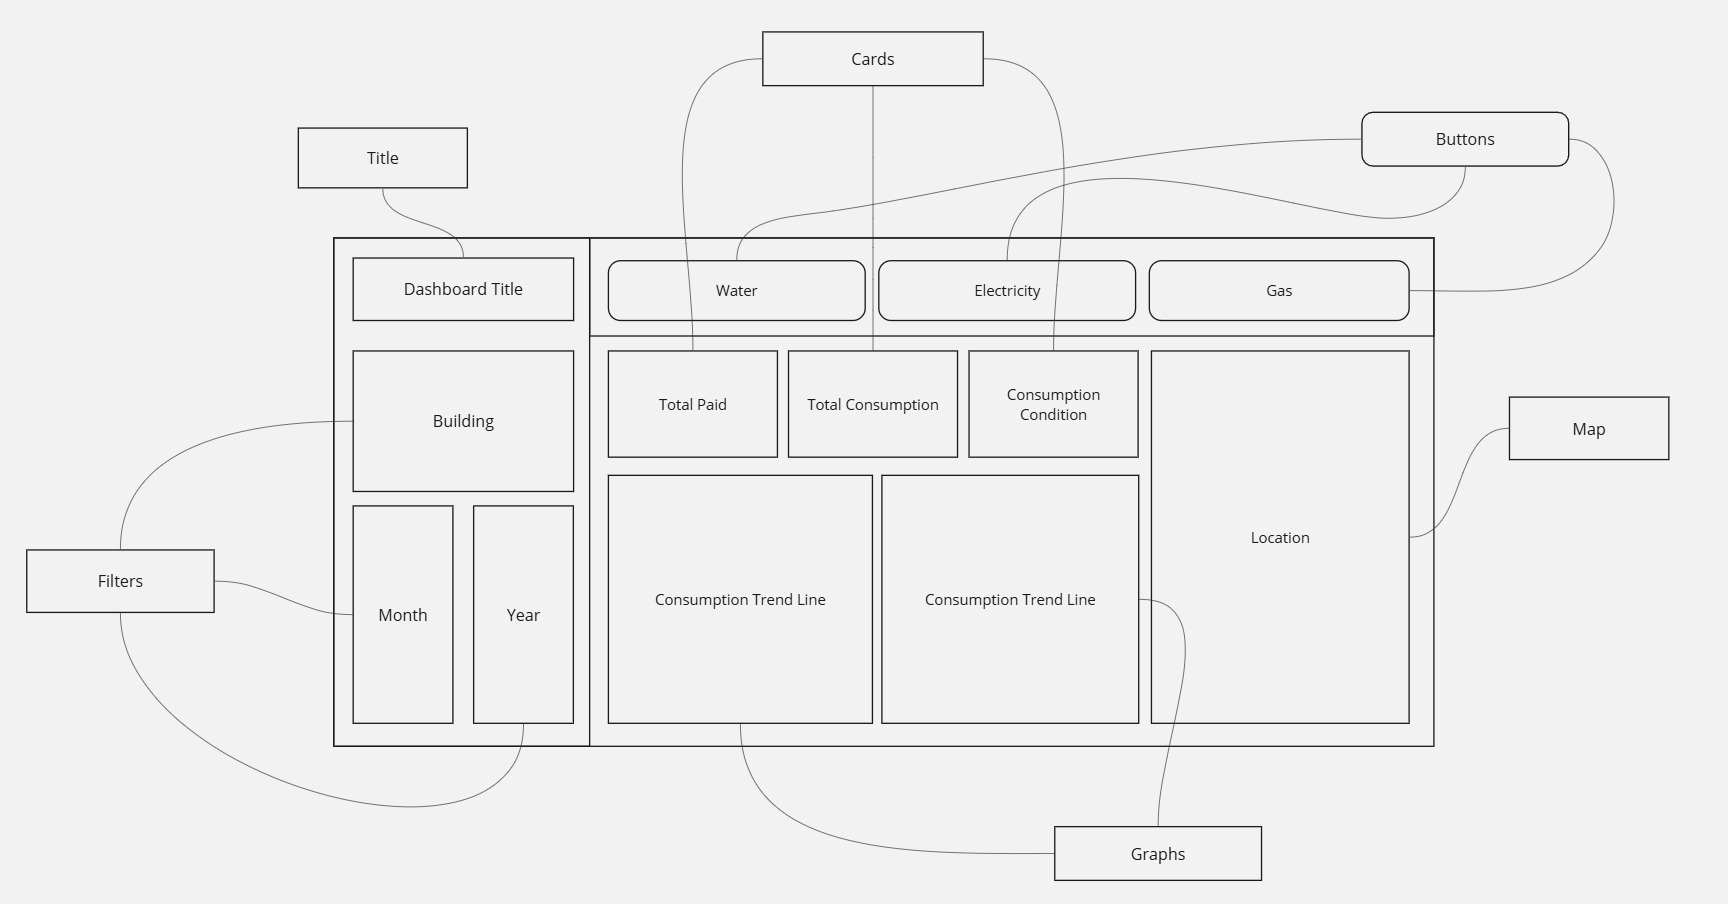
    Having aquired these tasks, I headed to my preferred white board website Miro and initiated designing the UI of the needed dashboard

    Database ERD

    erDiagram
        building_mastery {
            varchar building PK
            varchar city
            varchar county
            varchar state
        }
    
        consumptions {
            date date
            varchar building FK
            integer water_consumption
            integer electricity_consumption
            integer gas_consumption
        }
    
        rates {
            integer year
            varchar energy_type
            money price_per_unit
        }
    
        water_consumption_summary {
            varchar Building
            integer Water_Consumption
            money Price
            varchar City
            date Date
        }
    
        electricity_consumption_summary {
            varchar Building
            integer Electricity_Consumption
            money Price
            varchar City
            date Date
        }
    
        gas_consumption_summary {
            varchar Building
            integer Gas_Consumption
            money Price
            varchar City
            date Date
        }
    
        building_mastery ||--o{ consumptions : has
        consumptions }|--|| water_consumption_summary : generates
        consumptions }|--|| electricity_consumption_summary : generates
        consumptions }|--|| gas_consumption_summary : generates
        rates ||--|{ water_consumption_summary : calculates_price
        rates ||--|{ electricity_consumption_summary : calculates_price
        rates ||--|{ gas_consumption_summary : calculates_price
    
    Loading

    Data Preparation

    1. SQL Querying


    Before we dive into the querying phase we have a very improtant question. Why the use of SQL database while we can handle the data using a simple Excel workbook?

    Well, let’s suppose we have a bigger size of data that can’t be handled with Excel sheets, as the total number of rows that Excel can handle is 1,044,000 rows That’s not enough for big data querying, so that’s why SQL databases are efficient in managing the data. We can connect them to whatever software we use to visualize our insights, whether Excel, Power BI, or Tableau.


    1. Created a new database into my local PostgreSQL:
      CREATE DATABASE energy;
    2. Created the three tables in the dataset and imported thier values using COPY,FROM commands:
      CREATE TABLE consumptions (
          date DATE,
          building VARCHAR(10),
          water_consumption INT,
          electricity_consumption INT,
          gas_consumption INT
      )
      
      COPY consumptions (date, building, water_consumption, electricity_consumption, gas_consumption)
      FROM 'C:\Mine\DEPI\Projects\Energy Consumption Dataset\consumptions.csv'
      DELIMITER ','
      CSV HEADER
      
      CREATE TABLE building_mastery (
          building VARCHAR(10) PRIMARY KEY,
          city VARCHAR(25),
          county VARCHAR(10)
      )
      
      COPY building_mastery (building, city, county)
      FROM 'C:\Mine\DEPI\Projects\Energy Consumption Dataset\building_master.csv'
      DELIMITER ','
      CSV HEADER
      
      CREATE TABLE rates (
          year INT,
          energy_type VARCHAR(50),
          price_per_unit MONEY
      )
      
      COPY rates (year, energy_type, price_per_unit)
      FROM 'C:\Mine\DEPI\Projects\Energy Consumption Dataset\rates.csv'
      DELIMITER ','
      CSV HEADER;
      -- :D
    3. I had to assign the building column as a foreign key so I altered the table:
      ALTER TABLE consumptions
      ADD CONSTRAINT fk_building FOREIGN KEY (building)
      REFERENCES building_mastery (building);
    4. I decided that the best way to visualize the data as ordered is to create 3 views that will further be imported into Excel, and they were:
    • gas_consumption_summary
        CREATE VIEW gas_consumption_summary AS
        SELECT 
            building AS "Building",
            gas_consumption AS "Gas Consumption",
            CASE WHEN EXTRACT(YEAR FROM date) = g.year THEN price_per_unit * gas_consumption END AS "Price",
            city AS "City",
            date AS "Date"
        FROM consumptions
        JOIN building_mastery USING(building)
        JOIN (SELECT * FROM rates WHERE energy_type = 'Gas') AS g ON g.year = EXTRACT(YEAR FROM date);
    • electricity_consumption_summary
      CREATE VIEW electricity_consumption_summary AS
      SELECT 
          building AS "Building",
          electricity_consumption AS "Electricity Consumption",
          CASE WHEN EXTRACT(YEAR FROM date) = e.year THEN price_per_unit * electricity_consumption END AS "Price",
          city AS "City",
          date AS "Date"
      FROM consumptions
      JOIN building_mastery USING(building)
      JOIN (SELECT * FROM rates WHERE energy_type = 'Electricity') AS e ON e.year = EXTRACT(YEAR FROM date);
    • water_consumption_summary
      CREATE VIEW water_consumption_summary AS
      SELECT 
          building AS "Building",
          water_consumption AS "Water Consumption",
          CASE WHEN EXTRACT(YEAR FROM date) = wr.year THEN price_per_unit * water_consumption END AS "Price",
          city AS "City",
          date AS "Date"
      FROM consumptions
      JOIN building_mastery USING(building)
      JOIN (SELECT * FROM rates WHERE energy_type = 'Water') AS wr ON wr.year = EXTRACT(YEAR FROM date);

    2. Setting up PostgreSQL-Excel connection

    NPGSQL provides a great environment that allows us to create a connection beween PostgreSQL and Excel with whom we can use it to easily import the data as connection (and transform it if needed using Excel Power Query).


    3. Importing the data

    The next mentioned steps are in Microsoft Excel:

    1. Get Data > FROM ODBC.
    2. Choose the connection setup in NPGSQL.
    3. Select the views created in the sql database to be the main tables loaded into excel.
    4. Load the data by pressing load button.
    5. The data will the be loaded as connections.

    4. Power Pivot and DAX

    Take a look at the data in Power Pivot data model. One of the items needed can’t be performed without the use of Power Pivot and DAX which is Consumption Ratio. So I created 3 Power Pivot measures for the 3 tables mentioned as follows:

    • GasConsumptionRatio
      GasConsumptionRatio:=DIVIDE(
        SUM(gas_consumption_summary[Gas Consumption]),
        CALCULATE(
            SUM(gas_consumption_summary[Gas Consumption]),
            ALL(gas_consumption_summary[Building]),
            ALLSELECTED(gas_consumption_summary[Date (Year)]),
            ALLSELECTED(gas_consumption_summary[Date (Month)])
      ),0)
      
    • ElectricitConsumptionRatio
      ElectricityConsumptionRatio:=DIVIDE(
          SUM(electricity_consumption_summary[Electricity Consumption]),
          CALCULATE(
              SUM(electricity_consumption_summary[Electricity Consumption]),
              ALL(electricity_consumption_summary[Building]),
              ALLSELECTED(electricity_consumption_summary[Date (Year)]),
              ALLSELECTED(electricity_consumption_summary[Date (Month)])
          ),0)
      
    • WaterConsumptionRatio
      WaterConsumptionRatio:=DIVIDE(
        SUM(water_consumption_summary[Water Consumption]),
        CALCULATE(
            SUM(water_consumption_summary[Water Consumption]),
            ALL(water_consumption_summary[Building]),  -- Remove filters on Building
            ALLSELECTED(water_consumption_summary[Date (Year)]),  -- Keep slicers for Date (Year)
            ALLSELECTED(water_consumption_summary[Date (Month)])  -- Keep slicers for Date (Month)
        ),0)
      

    5. Additional step

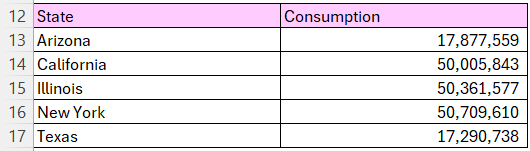
    There was actualy an additional step while I was preparing the data. Microsoft Excel doesn’t recognise the cities name to visualize them into a map chart, so I had to get back to the SQL database to setup the states names to each city mentioned in the building_mastery, and here’s the SQL code

    ALTER TABLE building_mastery
    ADD COLUMN state VARCHAR(50)
    
    UPDATE building_mastery
    SET state = 
        CASE
            WHEN city = 'New York' THEN 'New York'
            WHEN city = 'Chicago' THEN 'Illinois'
            WHEN city = 'Houston' THEN 'Texas'
            WHEN city = 'Phoenix' THEN 'Arizona'
            WHEN city = 'Los Angeles' THEN 'California'
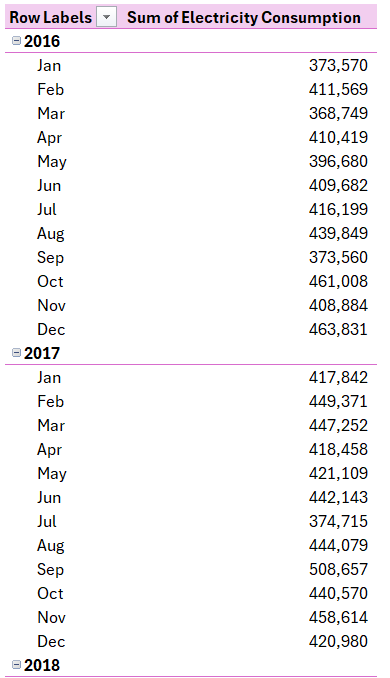
        END;

    Data Summarization

    To answer the project related questions, and using the help of the connection created between Excel and PostgreSQL database it would be easy to summarize the dat using Excel Pivot Tables for the 3 tables in our database and here they are:

    1. Total price paid.
    2. Consumption ratio.
    3. Consumption per Building to create the column chart as ordered.
    4. Consumption per State to create a chart map as ordered.
    5. Consumption over Time to create the trend line chart.

    Using the same method, I create the same Pivot Tables for each of the created tables in the dataset

    Data Visualization

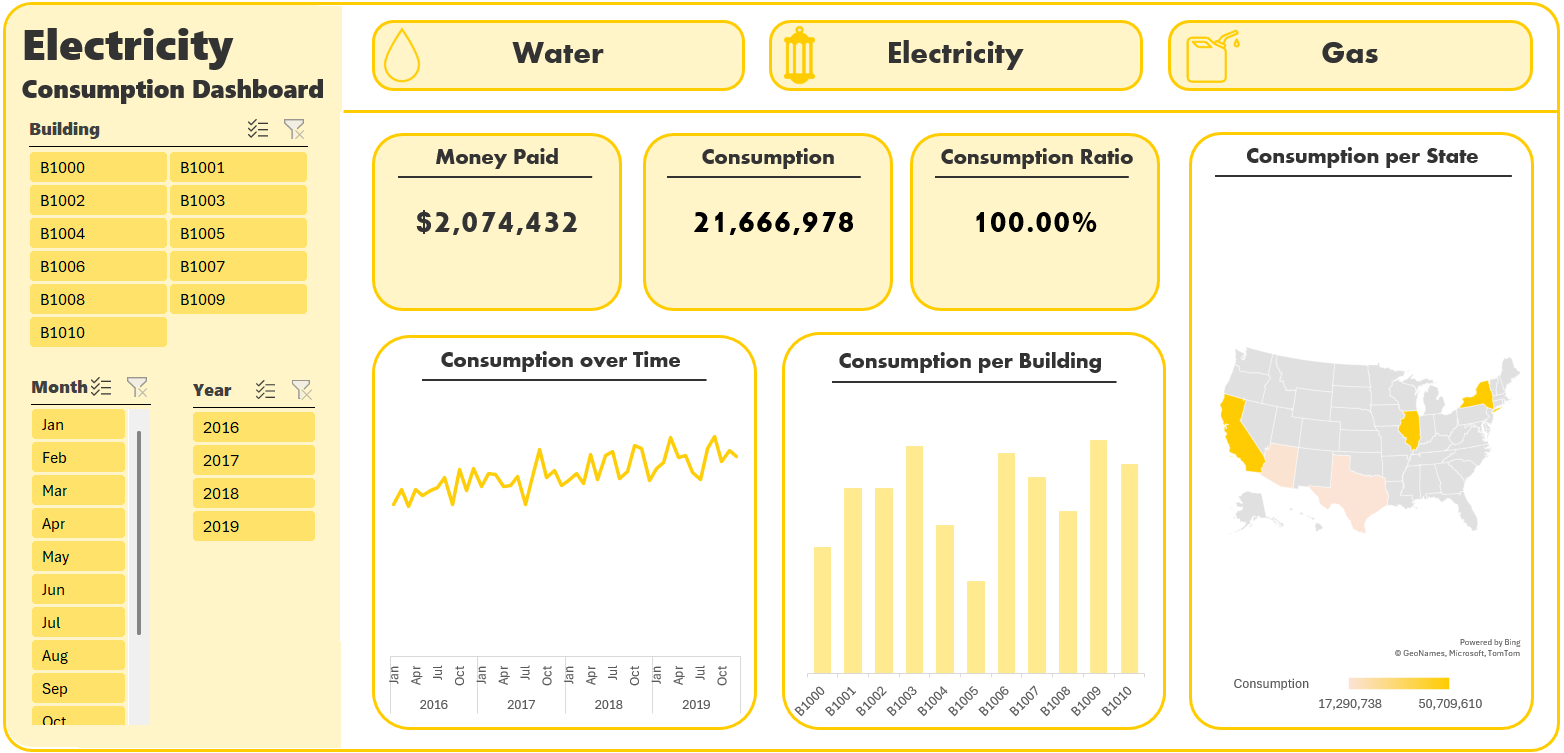
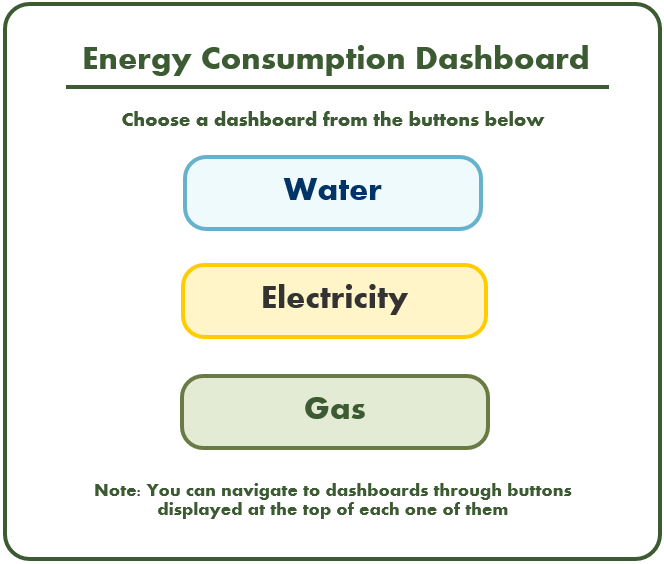
    Finaly, I created three customized dashboards and a main page to navigate through the dashboards pages using buttons to provide the user with suitable and customized user experience, the dashboards include:

    • Buttons with icons
    • Cards
    • Slicers
    • Trend Line
    • Column Chart
    • Map Chart

    Dasboards Linking

    Using the power of LLMs and Prompt Engineering, I asked the ChatGPT to create a VBA Code that creates macros that I can further assign to the shapes to navigate through the dashboards.

    The purpose of this step is to create make a good visual of the dashboard to change the theme according to what the dashboard is showing

    That’s that VBA code:

    Sub GoToElectricityDashboard()
        Sheets("Electricity Dashboard").Activate
    End Sub
    
    Sub GoToWaterDashboard()
        Sheets("Water Dashboard").Activate
    End Sub
    
    Sub GoToGasDashboard()
        Sheets("Gas Dashboard").Activate
    End Sub
    Sub GoToMain()
        Sheets("Main").Activate
    End Sub

    Dashboards Content

    Main Page
    Water Conumption Dashboard
    Electricity Consumption Dashboard
    Gas Consumption Dashboard
    Visit original content creator repository https://github.com/ahmedgalaaali/Energy-Consumption-Dashboard-SQL-Excel
  • neoman

    Neoman Multi-Configuration Manager

    Neoman

    The neoman project can be used to install, initialize, configure, and manage

    Neoman Managed Project Configs
    Asciiville MirrorCommand MusicPlayerPlus RoonCommandLine
    neovim neomutt newsboat btop++
    kitty neofetch w3m tmux

    These are powerful, configurable, extensible, character-based programs. Neoman automates the installation, initialization, configuration, and management of these tools using a command line and character menu interface.

    [Note:] This project is in early development and not yet ready to install

    Installation

    The initial installation of Neoman should be performed by a user with sudo privileges, not the root user. Issue the following two commands:

    # Install neoman with the following two commands:
    git clone https://github.com/doctorfree/neoman $HOME/.config/neoman
    $HOME/.config/neoman/neoman

    Subsequent use of the neoman command does not require sudo privilege and can be performed by any user.

    After installation is complete, run the neoman command to get started managing your Neoman system.

    The neoman command and menu interface

    The Neoman installation creates the neoman command which can be used to manage Neoman components via the command line or the Neoman menu interface.

    Asciiville management

    See https://asciiville.dev

    MirrorCommand management

    See https://mirrorcommand.dev

    MusicPlayerPlus management

    See https://musicplayerplus.dev

    RoonCommandLine management

    See https://rooncommand.dev

    Neovim management

    Neoman uses the Lazyman Neovim Configuration Manager to install Neovim, tools, and dependencies as well as multiple Neovim configurations, and the Bob Neovim version manager.

    NeoMutt management

    Neoman installs the versatile and highly configurable NeoMutt command line mail reader (based on Mutt) if not already present and installs a rich user NeoMutt configuration. The Neoman NeoMutt configuration can be managed via the neoman menu system.

    Newsboat management

    The Newsboat RSS/Atom feed reader is installed by Neoman and a rich newsboat configuration can be installed using neoman.

    Btop management

    The Btop++ system resource monitor shows usage and stats for processor, memory, disks, network, and processes. Neoman installs a precompiled btop in native package format and provides a themed btop user configuration.

    Kitty management

    The fast, feature-rich, GPU based Kitty terminal emulator is installed and an extensive Kitty configuration made available by Neoman.

    Neofetch management

    The Neofetch system information tool is managed through the neoman menu interface.

    Many Neofetch themes are included in neoman thanks primarily to the excellent work of Github user Chick2D.

    W3m management

    w3m is a text-based web browser as well as a pager like more or less. With w3m you can browse web pages through a terminal emulator window (e.g. kitty). Moreover, w3m can be used as a text formatting tool which typesets HTML into plain text.

    Neoman installs w3m and provides an extensive w3m configuration which includes a mailcap tailored for use with a character browser.

    Tmux management

    tmux is a terminal multiplexer. It enables multiple terminals to be created, accessed, and controlled from a single screen. Neoman installs tmux if not already present and provides an extensive user tmux configuration.

    Visit original content creator repository https://github.com/doctorfree/neoman
  • voll.med

    Voll.med

    Spring Boot 3: desenvolva uma API Rest em Java

    Estudos de Spring Boot do curso “Spring Boot 3: desenvolva uma API Rest em Java” da Alura.

    Neste curso irei desenvolver uma API REST para um consultório médico fictício chamado Voll.med.
    Como o curso é focado somente na construção de uma API REST utilizando Java e Spring, não terá nenhum tipo de interface do usuário, mas fica como desafio para mim fazer uma aplicação client-side que integra com essa API.

    Aula 1

    Criando o projeto

    Nessa aula vi como gerar um projeto Spring base com algumas dependências a partir do Spring Initializr, importar ele no IntelliJ e rodar a aplicação com um “Hello, World!”. Também aprendi a estrutura de um projeto Spring e um pouco da história do framework.

    Aula 2

    Primeira requisição POST

    Nessa aula vi como fazer o controller responder às requsições POST, pegando o corpo da requisição e imprimindo ele no console a partir de um objeto DTO (Data Transfer Object) intanciado a partir de um Record (recurso do Java que não havia utilizado até agora por ter focado apenas no Java 8 no começo)

    Aula 3

    Persistência dos dados

    Nessa aula vi como persistir os dados recebidos na requisição utilizando repositories, interfaces que estendem JpaRepository, que vem com uma série de métodos para fazer a integração com o banco de dados. Aprendi também a utilizar o Flyway, ferramenta de Migrations que o Spring dá suporte, e boas práticas para trabalhar com ele.
    Outro tópico da aula foi fazer a validação dos dados recebidos na requisição utilizando o módulo Validation do Spring, que possui várias annotations que facilitam muito na hora de fazer essas validações.

    Além do conteúdo da aula, como no curso estamos utilizando MySQL como banco de dados, resolvi aprender um pouco sobre docker e utilizar o MySQL a partir um container para manter a minha máquina com um bom desempenho.

    Aula 4

    Requisições GET e Paginação

    Nessa aula vi como fazer a API responder à requisições GET, retornando os dados aplicando uma paginação com o uso da interface Pageable e os dados em uma Page em vez de uma lista.

    Também vi como mudar o jeito que a paginação irá funcionar com o uso de query strings na própria requisição e como mudar o padrão usado pelo Spring com o uso da annotation @PageableDefault.

    Aula 5

    Requisições PUT e DELETE

    Nessa aula vi como fazer a API responder à requisições PUT e DELETE, para assim fazer a atualização e exclusão de registros no banco de dados.

    Também aprendi o conceito de exclusão lógica e como implementar isso utilizando o Spring, criando um novo campos “status” na tabela e mapeando-o na entidade.

    Além disso, foi mostrado no curso como fazer um método personalizado de listagem aplicando um filtro na interface repository, utilizando apenas o padrão de nomenclatura para o Spring fazer a filtragem automaticamente.

    Conclusão

    Estou muito feliz com o aprendizado que tive durante esse curso e com um entendimento muito maior do que o que eu tinha antes no básico do Spring, tendo em vista que já havia utilizado o framework no desenvolvimento de um projeto na empresa onde trabalho, mas não entendia realmente como as coisas que eu estava fazendo funcionavam por baixo dos panos.

    Mal posso esperar para começar o próximo curso!

    Spring Boot 3: aplique boas práticas e proteja uma API Rest

    Estudos de Spring Boot do curso “Spring Boot 3: aplique boas práticas e proteja uma API Rest” da Alura.

    Neste curso irei continuar o desenvolvimento da API REST da Voll.med, dessa vez aplicando boas práticas e protejendo-a.

    Aula 1

    Boas práticas com ResponseEntity

    Nessa aula vi a importância de se retornar os status codes certos nas respostas da nossa API, assim seguindo as boas práticas e deixando mais explícito ao cliente o resultado da requisição.

    Para realmente aplicar as boas práticas dos status codes e corpos de respostas, aprendi o funcionamento da classe ResponseEntity, que facilita muito nesse quesito.

    Também aprendi um pouco mais de como trabalhar com objetos Optional, coisa que não havia tido oportunidade de usar ainda.

    Aula 2

    Tratando erros e padronizando respostas

    Nessa aula vi como tratar os erros gerados em requisições feitas de maneira não esperada com o uso de uma classe @RestControllerAdvice, utilizando métodos @ExceptionHandler e retornando ResponseEntities que fazem mais sentido e seguem as boas práticas, informando realmente o que deu errado na requisição.

    Também vi como podemos mudar o padrão do Spring em lidar com Exceptions causadas nas requisições por meio do arquivo “application.properties”, usando propriedades padrões do Spring que podemos pegar na documentação.

    Aula 3

    Autenticação com Spring Security

    Nessa aula vi como utilizar o Spring Security para fazer a autenticação e autorização dos usuários na nossa API.

    Aprendi todo o fluxo de autenticação de um usuário na API com o Spring Security, o conceito de Stateless usando JWT e como ajustar o comportamento do módulo usando uma classe de configuração que disponibiliza objetos @Bean para o Spring usar automaticamente em situações específicas, ou manualmente por meio da injeção de dependência usando a annotation @Autowired.

    Aula 4

    Geração de tokens JWT

    Nessa aula vi como utilizar a biblioteca “java-jwt” da Auth0 para gerar os tokens JWT após a autenticação do usuário e entendi um pouco mais de como os tokens JWT funcionam.

    Também aprendi como utilizar variáveis de ambiente em propriedades do arquivo application.properties e como injetar propriedades que não são padrão do Spring utilizando a annotation @Value.

    Aula 5

    Autorização utilizando os tokens

    Nessa aula vi como fazer a autorização de usuários na API validando o token JWT por meio de um Filter que filtra a requisição antes mesmo de ela chegar no controller.

    Também aprendi que não basta fazermos a autorização por meio do token enviado no Header da requisição, só com isso o Spring não considera o usuário autenticado e autorizado. Para o Spring realmente fazer a autenticação/autorização, precisamos especificar na nossa classe de configurações de segurança como o Spring Security deve se comportar na autenticação em cada requisição, já que ele está no modo Stateless e não mantém uma sessão do usuário logado.

    Também aprendi como forçar o Spring Security a autorizar um usuário após a verificação do token JWT, tendo em vista que se não forçamos ele a fazer isso e não modificamos a ordem dos filtros, ele nunca irá autorizar nenhum usuário, mesmo ele tendo enviado um token válido no Header da requisição.

    Foi uma aula com muito conteúdo e nem tudo está fixado na minha cabeça ainda, por isso estou praticando bastante e vou voltar nessa aula posteriormente, pois sei que é um assunto de extrema importância e um tanto complexo quando ainda não estamos acostumados com como funciona.

    Conclusão

    Nesse curso aprendi muita coisa interessante e importante, desde como ter respostas personalizadas na API tratando as Exceptions causadas pelas requisições, até como fazer uma autenticação e autorização completa de usuários na API seguindo o modelo Stateless, entre muitos outros detalhes de como tudo funciona.

    Sem dúvida foi o curso mais complexo de Spring que finalizei até agora e me sinto muito mais preparado para continuar estudando e melhorando cada vez mais.

    Spring Boot 3: documente, teste e prepare uma API para o deploy

    Estudos de Spring Boot do curso “Spring Boot 3: documente, teste e prepare uma API para o deploy” da Alura.

    Neste curso irei continuar o desenvolvimento da API REST da Voll.med, dessa vez adicionando novas funcionalidades de agendamento e cancelamento de consultas com validações mais complexas. Também irei aprender a como gerar uma documentação para a API, assim como prepará-la para o deploy.

    Aula 1

    Começando com novas funcionalidades

    Nesta aula vi a importância de isolar regras de negócio e lógicas em classes @Service, assim fazendo com que os controllers tenham apenas a responsabilidade de tratar o fluxo das requisições, chamando a lógica de outro lugar.

    Também aprendi como fazer validações de integridade das informações recebidas nas requisições, ou seja, além de fazer as verificações básicas que já havia feito com o Spring Validation, validar se existe uma entidade com o id passado no atributo da requisição, por exemplo.

    Além disso, aprendi como criar queries personalizadas no nosso banco de dados para aplicarmos lógicas de filtragem mais complexas e que não seriam possíveis de fazer apenas seguindo o padrão de nomenclatura dos métodos do respository.

    Aula 2

    Fazendo validações e aplicando SOLID

    Nesta aula vi como aplicar validações de regras de negócio seguindo alguns dos princípios SOLID, assim tornando o processo de manutenção dessas validações, ou até mesmo o processo de acrescentar uma nova validação, mais fácil.

    Também aprendi como utilizar interfaces nas classes de validação das regras de negócio para conseguir usar o polimorfismo, dessa forma não tendo que instanciar uma por uma no nosso @Service, apenas tendo que injetar uma List com o tipo da nossa interface utilizando o @Autowired, assim podendo utilizar o método “forEach();” para iterar por cada classe de validação executando a validação. Isso torna o processo de adicionar/remover validações muito mais simples.

    Aula 3

    Documentando a API

    Nessa aula vi como utilizar o SpringDoc para gerar a documentação de APIs feitas com Spring, uma ferramenta muito poderosa e simples de usar que automatiza o processo de documentação de APIs gerando um JSON que pode ser lido por outra ferramenta, ou até mesmo utilizado para automatização do processo de criação de aplicações clientes que integram com a nossa API, além de gerar uma interface gráfica no navegador com base no Swagger UI que podemos utilizar como ferramenta de teste da nossa API, assim como um Insomnia ou Postman.

    Também vi como aplicar configurações diferenciadas na geração dessa interface gráfica utilizando uma classe @Configuration que retorna um @Bean do tipo OpenAPI, onde podemos aplicar diversas configurações.

    Além disso, aprendi um pouco da história do Swagger e do OpenAPI e a importância de padronizarmos a documentação das nossas APIs.

    Aula 4

    Testando repositories e controllers

    Nesta aula vi como utilizar o módulo de testes padrão do Srping (o que já vem como dependência quando iniciamos o projeto a partir do Spring Initializr) para aplicar testes de unidade e de integração nas classes repository e controller do projeto. No curso não foi mostrado como fazer os testes nas validações de regras de negócio, pois fugia do escopo de testes no Spring, onde esses testes não necessitariam de nenhum contexto do Spring em si para serem rodados.

    Aprendi também o fluxo given/when/then, algo que não tinha visto antes e que ajuda bastante a entender como funciona o fluxo de um teste.

    Vi como configurar os testes nos repositories de modo que os testes sejam feitos em um banco de dados exclusivo para testes criando novos profiles com outros arquivos application.properties, como utilizar mocks para fazer testes em controllers onde a requisição é simulada, como utilizar o JacksonTester para transformar DTOs em strings JSON e muitos outros detalhes sobre como essas coisas funcionam.

    Foi uma aula muito completa e com muito conteúdo novo. Sem dúvida irei rever as aulas algumas vezes para fixar o conhecimento, pois são muitas classes e muitos detalhes para conseguir realmente ter tudo funcionando do jeito que queremos.

    Aula 5

    Buildando o projeto

    Nesta aula vi como buildar o projeto em um arquivo .jar utilizando o Maven pelo próprio IntelliJ, criando um novo profile para produção, onde as propriedades de conexão e autenticação ao banco de dados são lidas de variáveis de ambiente, assim tornando a aplicação menos vulnerável e modificável, caso seja necessário mudar essas propriedades, sem ter necessidade de buildar o projeto novamente.

    Também aprendi como escolher o profile a ser utilizado ao rodar o .jar, assim como passar as variáveis de ambiente definidas no profile por meio de parâmetros no comando de subir a aplicação.

    Além disso, vi que gerar um .jar não é a única escolha disponível para buildar a nossa aplicação, podemos também buildar ela para um arquivo .war ou uma Native Image com o GraalVM, o que faz com que a nossa aplicação se torne um binário executável, sem precisar da JVM para rodar e com uma performance muito mais alta.

    Conclusão

    Neste curso aprendi coisas muito importantes no desenvolvimento de APIs REST com o Spring Boot, sendo elas:

    • Como fazer queries personalizadas no banco de dados;
    • Como aplicar princípios SOLID ao criar validações de regras de negócio, assim tornando a manutenção e adição de novas validações muito mais fácil;
    • Como gerar uma documentação seguindo a especificação OpenAPI utilizando o SpringDoc;
    • Como fazer testes automatizados nos repositories e controllers da API utilizando JUnit, AssertJ e Mockito;
    • Como fazer o build final da aplicação e as alternativas que temos.

    Com a finalização deste curso, também finalizei a formação Java e Spring Boot, onde aprendi muita coisa e pude desenvolver um projeto muito interessante aplicando os conhecimentos obtidos durante as aulas.

    Tenho noção de que ainda tenho muita coisa para aprender no Spring para realmente dominar o framework e seus módulos, mas após ter finalizado essa formação me sinto muito mais confortável para desenvolver novos projetos e aprender as coisas que ainda não sei pesquisando e aplicando-as.

    Estou muito feliz com toda essa jornada de estudos que tive até agora e muito animado com o que vem pela frente!

    Visit original content creator repository
    https://github.com/raphaelrighetti/voll.med

  • addin-postgres

    addin-postgres

    Внешняя компонента для 1С:Предприятие 8 для выполнения запросов к postgresql и получения уведомлений.

    Технологии

    • Написана на языке RUST – blazing fast, memory safe и т.д.))
    • Выполнена по технологии Native API
    • Кроссплатформена – Linux + Windows.
    • Собирается с помощью свободных инструментов, msvc не нужен.

    Особенности

    • На первом этапе реализованы только простые запросы. Это запросы которые нельзя параметризовать, могут иметь несколько операторов разделенных ; и возвращают данные в текстовом виде, подробнее см. https://postgrespro.ru/docs/postgresql/15/protocol-flow#id-1.10.6.7.4
    • В компоненте реализовано получение уведомлений, сгенерированных командой NOTIFY. Основной сценарий – получение уведомлений об изменении данных в нужных таблицах. Это позволяет сделать простой брокер на postgresql (имеет смысл в случае не очень большой нагрузки). Либо для оперативного получения событий изменения данных в 1С, т.к. уведомления будут отправлены только после завершения транзакции. В этом случае, предполагается, что будет всегда запущено фоновое задание, которое будет слушать эти события. Подробности см. https://postgrespro.ru/docs/postgresql/15/sql-notify.
    • Все методы компоненты всегда являются функциями, даже если возвращать ничего не нужено, то будет возвращено Неопределено. Это нужно, чтобы можно было что-то вычислить в отладчике.
    • Если при вызове метода или при обращении к свойству компоненты возникает исключение, то текст исключения должен быть в свойстве LastError. Эта особенность из-за api внешних компонент, которое не позволяет передать текст исключения. Свойство сбрасывается при вызове любых методов а также при записи любого свойства.
    • Т.к. api внешних компонент не позволяет передавать массивы значений и объекты, то в случае такой необходимости будет возвращаться Json как объект ДвоичныеДанные в кодировке UTF-8. Именно такой формат обусловлен тем, что RUST хранит свои строки в кодировке UTF-8, а в кодировке UTF-16, таким образом такой формат требует меньше лишних вычислений.

    API

    Свойства

    • LastError – Строка – возвращает последнюю ошибку, в случае когда будет брошено исключено.
    • Connected – Булево – возвращает Истина если активно подключение.

    Методы

    • Connect(СтрокаПодключения: Строка): Неопределено – в случае неуспешного подключения будет брошено исключение, ошибку можно посмотреть в свойстве LastError.
    • SimpleQuery(Запрос: Строка): ДвоичныеДанные – выполняет простой запрос, результат возвращается как Json в бинарном виде в кодировке utf-8.
    • Notifications(Таймаут: Число): ДвоичныеДанные – получает уведомления, перед этим нужно выполнить один или несколько запросов LISTEN. Таймаут задает ожидание в миллисекундах.

    Пример кода

    Процедура ПолучениеУведомлений()
        
        СтрокаСоединения = "host=/var/run/postgresql port=5432 dbname=test user=postgres application_name=AddinPostgres";
        ИмяФайла = "/var/1C/obmen/libaddin_postgres.so";
        
        Если Не ПодключитьВнешнююКомпоненту(ИмяФайла, "Test", ТипВнешнейКомпоненты.Native, ТипПодключенияВнешнейКомпоненты.НеИзолированно) Тогда
            ВызватьИсключение "Не удалось подключить внешнюю компоненту";
        КонецЕсли;
        
        Postgres = Новый ("Addin.Test.Postgres");
        
        Попытка
            
            Postgres.Connect(СтрокаСоединения);
            
            ТекстЗапросаФункции = 
            "CREATE OR REPLACE FUNCTION notify()
            |RETURNS TRIGGER AS
            |$$
            |BEGIN
            |    PERFORM pg_notify(TG_TABLE_NAME, '');
            |    RETURN NEW;
            |END;
            |$$
            |LANGUAGE PLPGSQL"; 
            
            ШаблонТриггера = 
            "CREATE OR REPLACE TRIGGER notify
            |AFTER INSERT OR UPDATE OR DELETE ON %1
            |EXECUTE FUNCTION notify();";
            
            Запросы = Новый Массив;
            Запросы.Добавить(ТекстЗапросаФункции);
            
            Для Каждого Справочник Из Метаданные.Справочники Цикл
                
                ОбъектыМетаданных = Новый Массив;
                ОбъектыМетаданных.Добавить(Справочник);
                ИменаТаблиц = ПолучитьСтруктуруХраненияБазыДанных(ОбъектыМетаданных, Истина);
                ИмяТаблицы = ИменаТаблиц.Найти("Основная", "Назначение").ИмяТаблицыХранения;
                
                Запросы.Добавить(СтрШаблон(ШаблонТриггера, ИмяТаблицы));
                Запросы.Добавить(СтрШаблон("LISTEN %1", ИмяТаблицы));
                
            КонецЦикла;
            
            ТекстЗапроса = СтрСоединить(Запросы, Символы.ПС + ";" + Символы.ПС);
            Postgres.SimpleQuery(ТекстЗапроса);
            
            Пока Истина Цикл
                
                Результат = Postgres.Notifications(5000);
                Уведомления = JsonВОбъект(Результат); 
                Если Уведомления.Количество() = 0 Тогда
                    Продолжить;
                КонецЕсли;
                Строки = Новый Массив;
                Для Каждого Уведомление Из Уведомления Цикл
                    Строки.Добавить(Уведомление.Channel);
                КонецЦикла;
                ЗаписьЖурналаРегистрации("Отладка", , , , СтрШаблон("Получены уведомления: %1", СтрСоединить(Строки, ",")));
                
                Если НеобходимостьЗавершенияСоединения().НеобходимоЗавершить Тогда
                    Прервать;
                КонецЕсли;
                
            КонецЦикла;
            
        Исключение
            
            Если Не ПустаяСтрока(Postgres.LastError) Тогда
                ВызватьИсключение Postgres.LastError;
            КонецЕсли;
            
            ВызватьИсключение;
            
        КонецПопытки;
        
    КонецПроцедуры 
    
    Функция JsonВОбъект(ДвоичныеДанные)
        
        ЧтениеJSON = Новый ЧтениеJSON();
        ЧтениеJSON.ОткрытьПоток(ДвоичныеДанные.ОткрытьПотокДляЧтения());
        Данные = ПрочитатьJSON(ЧтениеJSON);
        ЧтениеJSON.Закрыть();
        
        Возврат Данные;
        
    КонецФункции

    Возможные варианты использования

    Оперативная отправка данных из 1С при изменении данных

    В 1С нет события ПослеТранзакции, но оно требуется чтобы например оперативно отправить измененные данные. В таком случае можно в регламентном задании слушать события изменения нужных таблиц и оперативно реагировать. Кто-то скажет, что постоянно запущенное фоновое задание это антипаттерн, но при использовании 1С:Шина тоже постоянно запущено фоновое задание, поэтому считаю такой вариант официально рекомендуемым.

    Простой брокер сообщений

    Многие хотят использовать брокер и эта компонента позволяет сделать это довольно дешево. Но такой вариант подходит для простых случаев и небольшой нагрузки. Примерная схема выглядит так: в базе создается таблица для сообщений, поставщики пишут туда свои сообщения, а потребитель при получении уведомлений вычитывает их из этой таблицы. В таком случае, триггер для уведомления имеет смысл делать только для события INSERT.

    Обмен сообщениями между сеансами

    В этом варианте не нужно создвать ни таблиц, ни триггеров. Имеет смысл только создать пустую базу и пользователя, который имеет доступ только к этой базе.
    В одном сеансе можно слушать сообщения:

    Postgres.SimpleQuery("LISTEN my_channel");
    Пока Истина Цикл
        Результат = Postgres.Notifications(5000);
        Уведомления = JsonВОбъект(Результат.Значение); 
        Для Каждого Уведомление Из Уведомления Цикл
            ОбработкаСообщения(Уведомление.Payload);
        КонецЦикла;
    КонецЦикла;

    Из других сеансов отправлять сообщения:

    Postgres.SimpleQuery("NOTIFY my_channel, 'This is the payload'");

    Visit original content creator repository
    https://github.com/medigor/addin-postgres

  • jmeter-elastic-apm

    jmeter-elastic-apm logo

    Manages the integration of ElasticSearch Application Performance Monitoring API in the Apache JMeter.

    Link to github project jmeter-elastic-apm

    An article “Why and How To Integrate Elastic APM in Apache JMeter” about this plugin and some advices:
    https://dzone.com/articles/integrating-elastic-apm-in-apache-jmeter

    Apache JMeter with integration of ElasticSearch Application Performance Monitoring

    This tool manages the integration of ElasticSearch Application Performance Monitoring API in the Apache JMeter.

    The main goal is to show the timeline of pages declared in JMeter script in the Kibana APM. For each page on the JMeter side, have all the server-side calls grouped together, the SQL queries and the inter-application exchanges in the notion of page.

    This tool adds JSR223 groovy sampler to create a new APM Transaction before a JMeter Transaction Controller and adds JSR223 groovy sampler to end the transaction after the JMeter Transaction Controller

    This tool adds also User Defined Variables for elastic APM configuration

    This tool could remove all JSR223 groovy that contains api calls to return to the initial JMeter script.

    Example

    A simple JMeter script with 3 Transaction Controller corresponding to 3 different pages

    Simple script

    Launch the tool to modify the script : script1.jmx

    java -jar jmeter-elastic-apm-<version>-jar-with-dependencies.jar -file_in script1.jmx -file_out script1_add.jmx -action ADD -regex SC.*
    

    and the script (script1_add.jmx) after action = ADD

    Each JMeter Transaction Controller (page) is surround with a begin transaction and an end transaction (use groovy api call).

    In the “groovy begin transaction apm”, the groovy code calls the ElasticApm API (simplified code) :

    Transaction transaction = ElasticApm.startTransaction();
    Scope scope = transaction.activate();
    transaction.setName(transactionName); // contains the JMeter Transaction Controller Name
    

    And in the “groovy end transaction apm”, the groovy code calls the ElasticApmp API (simplified code):

    transaction.end();
    

    Script with elastic APM configuration and groovy code

    In View Results Tree, you will see new request headers (traceparent and elastic-apm-traceparent) automatically added by the elastic apm agent with the transaction id (e.g: 4443e451a1f7d42abdfbd739d455eac5) created by the jsr223 groovy begin transaction apm.

    View Results Tree with traceparent

    You will see all Transactions in Kibana with the vision of the page in JMeter (JMeter Transaction Controller usually == page) (click on image to see the full size image)

    kibana jmeter page

    And the TIMELINE for JMeter Transaction Controller, you see the JMeter Page and the web application gestdoc running in Tomcat (click on image to see the full size image)

    kibana timeline_tc

    Simplified architecture diagram

    The simplified architecture : Apache JMeter and a java apm agent, Apache Tomcat and the java apm agent with web application gestdoc, ElasticSearch suite with ElasticSearch, APM Server and Kibana, a user views the Kibana Dashboards with navigator.

    simplified architecture

    License

    See the LICENSE file Apache 2 https://www.apache.org/licenses/LICENSE-2.0

    Ready to use

    In the Release of the project you will find the tool compiled in one (uber) jar file which is directly usable.

    Help

    [main] INFO io.github.vdaburon.jmeter.elasticapmxml.ElasticApmJMeterManager - main begin
    usage: io.github.vdaburon.jmeter.elasticapmxml.ElasticApmJMeterManager -action <action> [-extract_end <extract_end>]
           [-extract_start <extract_start>] [-extract_udv <extract_udv>] -file_in <file_in> -file_out <file_out> [-help]
           [-regex <regex>]
    io.github.vdaburon.jmeter.elasticapmxml.ElasticApmJMeterManager
     -action <action>                 action ADD or REMOVE, ADD : add groovy api call and REMOVE : remove groovy api call
     -extract_end <extract_end>       optional, file contains groovy end call api (e.g : extract_end.xml), default read file
                                      in the jar
     -extract_start <extract_start>   optional, file contains groovy start call api (e.g : extract_start.xml), default read
                                      file in the jar
     -extract_udv <extract_udv>       optional, file contains User Defined Variables (e.g : extract_udv.xml), default read
                                      file in the jar
     -file_in <file_in>               JMeter file to read (e.g : script.jmx)
     -file_out <file_out>             JMeter file modified to write (e.g : script_add.jmx)
     -help                            Help and show parameters
     -regex <regex>                   regular expression matches Transaction Controller Label (default .*) (e.g : SC[0-9]+_.
                                      for SC01_P01_HOME or SC09_P12_LOGOUT)
    E.g : java -jar jmeter-elastic-apm-<version>-jar-with-dependencies.jar -file_in script1.jmx -file_out script1_add.jmx
    -action ADD -regex SC.*
    E.g : java -jar jmeter-elastic-apm-<version>-jar-with-dependencies.jar -file_in script1_add.jmx -file_out
    script1_remove.jmx -action REMOVE -regex .*
    [main] INFO io.github.vdaburon.jmeter.elasticapmxml.ElasticApmJMeterManager - main end (exit 1) ERROR


    Properties in the User Defined Variables

    This tool add “User Defined Variables” with default value

    User Defined Variables for elastic APM

    This variables could be changed with JMeter properties at launch time, this properties could be set with -J<property>

    elastic APM properties are :

    property name comment
    param_apm_active default : TRUE , TRUE OR FALSE, if TRUE then api is call
    param_apm_prefix default : Empty , Prefix of the transaction name, could be empty, if param_apm_prefix = “TR_” then SC01_LOGIN will be TR_SC01_LOGIN

    E.g : jmeter -Jparam_apm_prefix=TRANS_ , SC01_LOGIN will be TRANS_SC01_LOGIN in Kibana transactions list

    Limitation at one level Transaction Controller

    The main limitation of this tool is only one Transaction Controller level. You can’t instrument a Transaction Controller that contains others Transaction Controller because the groovy script use ONE variable to save the Transaction Controller Label. The Parent Transaction Controller set the label and the children Transaction Controller set the same variable and overwrite previous parent label. As a result, the parent will not have an end of transaction.

    You can manually remove the groovy code before the parent Transaction Controller or give the regular expression for only children Transaction Controller.

    Start Apache JMeter with ELASTIC APM agent and ELASTIC APM api library

    Declare the ELASTIC APM Agent

    Url to find the apm agent : https://mvnrepository.com/artifact/co.elastic.apm/elastic-apm-agent

    Add the ELASTIC APM Agent somewhere in the filesystem (could be in the <JMETER_HOME>\lib but not mandatory)

    In <JMETER_HOME>\bin modify the jmeter.bat or setenv.bat

    Add ELASTIC APM configuration likes :

    set APM_SERVICE_NAME=yourServiceName
    set APM_ENVIRONMENT=yourEnvironment
    set APM_SERVER_URL=http://apm_host:8200
    
    set JVM_ARGS=-javaagent:<PATH_TO_AGENT_APM_JAR>\elastic-apm-agent-<version>.jar -Delastic.apm.service_name=%APM_SERVICE_NAME% -Delastic.apm.environment=%APM_ENVIRONMENT% -Delastic.apm.server_urls=%APM_SERVER_URL%
    

    Another solution, create a windows shell likes jmeter_with_elasticapm.bat in the <JMETER_HOME>\bin:

    set APM_SERVICE_NAME=yourServiceName
    set APM_ENVIRONMENT=yourEnvironment
    set APM_SERVER_URL=http://apm_host:8200
    set JVM_ARGS=-javaagent:<PATH_TO_AGENT_APM_JAR>\elastic-apm-agent-<version>.jar -Delastic.apm.service_name=%APM_SERVICE_NAME% -Delastic.apm.environment=%APM_ENVIRONMENT% -Delastic.apm.server_urls=%APM_SERVER_URL% & jmeter.bat 
    

    Remark the & jmeter.bat at end of the line with set JVM_ARGS

    Add the ELASTIC APM library

    Add the ELASTIC APM api library in the <JMETER_HOME>\lib\apm-agent-api-<version>.jar

    This library is use by JSR223 groovy code.

    Url to find the ELASTIC APM library : https://mvnrepository.com/artifact/co.elastic.apm/apm-agent-api

    Use jmeter maven plugin and elastic java agent

    You could launch a load test with the jmeter maven plugin and ELASTIC APM Agent

    https://github.com/jmeter-maven-plugin/jmeter-maven-plugin

    Paths are relative to the home maven project

    • Put your csv files in /src/test/jmeter directory (e.g : logins.csv)
    • Put the apm-agent-api-${elastic_apm_version}.jar in /src/test/jmeter directory
    • Put your jmeter script that contains groovy code added with jmeter-elastic-apm tool in /src/test/jmeter directory (e.g : script1_add.jmx)
    • In the maven build section, in the configuration > testPlanLibraries > declare the apm api library co.elastic.apm:apm-agent-api:${elastic_apm_version}
    • In the jMeterProcessJVMSettings > arguments add apm agent configuration likes:
    -javaagent:${project.build.directory}/jmeter/testFiles/elastic-apm-agent-${elastic_apm_version}.jar
    -Delastic.apm.service_name=${elastic_apm_service_name}
    -Delastic.apm.environment=${elastic_apm_environment}
    -Delastic.apm.server_urls=${elastic_apm_urls}


    A pom.xml example, the elastic_apm_version is set to “1.37.0” for the ELASTIC APM Agent agent and the ELASTIC APM library but you could choose another version :

    <elastic_apm_version>1.37.0</elastic_apm_version> <elastic_apm_service_name>YourServiceNane</elastic_apm_service_name> <elastic_apm_environment>YourEnvironment</elastic_apm_environment> <elastic_apm_urls>http://apm_server:8200</elastic_apm_urls> </properties> <build> <plugins> <plugin> <groupId>com.lazerycode.jmeter</groupId> <artifactId>jmeter-maven-plugin</artifactId> <version>3.6.1</version> <executions> <execution> <id>configuration</id> <goals> <goal>configure</goal> </goals> </execution> <execution> <id>jmeter-tests</id> <goals> <goal>jmeter</goal> </goals> </execution> </executions> <configuration> <jmeterVersion>5.5</jmeterVersion> <testPlanLibraries> <artifact>co.elastic.apm:apm-agent-api:${elastic_apm_version}</artifact> </testPlanLibraries> <downloadExtensionDependencies>false</downloadExtensionDependencies> <jMeterProcessJVMSettings> <xms>${jvm_xms}</xms> <xmx>${jvm_xmx}</xmx> <arguments> <argument>-javaagent:${project.build.directory}/jmeter/testFiles/elastic-apm-agent-${elastic_apm_version}.jar</argument> <argument>-Delastic.apm.service_name=${elastic_apm_service_name}</argument> <argument>-Delastic.apm.environment=${elastic_apm_environment}</argument> <argument>-Delastic.apm.server_urls=${elastic_apm_urls}</argument> <argument>-Duser.language=en</argument> </arguments> </jMeterProcessJVMSettings> <testFilesIncluded> <jMeterTestFile>script1_add.jmx</jMeterTestFile> </testFilesIncluded> <logsDirectory>${project.build.directory}/jmeter/results</logsDirectory> <generateReports>false</generateReports> <testResultsTimestamp>false</testResultsTimestamp> <resultsFileFormat>csv</resultsFileFormat> </configuration> </plugin> </plugins> </build> </project>’>
    <project xmlns="http://maven.apache.org/POM/4.0.0" xmlns:xsi="http://www.w3.org/2001/XMLSchema-instance"
             xsi:schemaLocation="http://maven.apache.org/POM/4.0.0 https://maven.apache.org/xsd/maven-4.0.0.xsd">
        <modelVersion>4.0.0</modelVersion>
        <groupId>io.github.vdaburon.jmeter</groupId>
        <artifactId>gestdoc-maven-launch-loadtest-apm</artifactId>
        <version>1.0</version>
        <properties>
            <project.build.sourceEncoding>UTF-8</project.build.sourceEncoding>
            <maven.compiler.source>1.8</maven.compiler.source>
            <maven.compiler.target>1.8</maven.compiler.target>
            <jvm_xms>256</jvm_xms>
            <jvm_xmx>756</jvm_xmx>
    
            <!-- elastic APM -->
            <elastic_apm_version>1.37.0</elastic_apm_version>
            <elastic_apm_service_name>YourServiceNane</elastic_apm_service_name>
            <elastic_apm_environment>YourEnvironment</elastic_apm_environment>
            <elastic_apm_urls>http://apm_server:8200</elastic_apm_urls>
        </properties>
    
        <build>
            <plugins>
                <plugin>
                    <!-- launch test : mvn clean verify -->
                    <groupId>com.lazerycode.jmeter</groupId>
                    <artifactId>jmeter-maven-plugin</artifactId>
                    <version>3.6.1</version>
                    <executions>
                        <!-- Generate JMeter configuration -->
                        <execution>
                            <id>configuration</id>
                            <goals>
                                <goal>configure</goal>
                            </goals>
                        </execution>
                        <!-- Run JMeter tests -->
                        <execution>
                            <id>jmeter-tests</id>
                            <goals>
                                <goal>jmeter</goal>
                            </goals>
                        </execution>
                    </executions>
                    <configuration>
                        <jmeterVersion>5.5</jmeterVersion>
                        <testPlanLibraries>
                            <artifact>co.elastic.apm:apm-agent-api:${elastic_apm_version}</artifact>
                        </testPlanLibraries>
                        <downloadExtensionDependencies>false</downloadExtensionDependencies>
                        <jMeterProcessJVMSettings>
                            <xms>${jvm_xms}</xms>
                            <xmx>${jvm_xmx}</xmx>
                            <arguments>
                                <argument>-javaagent:${project.build.directory}/jmeter/testFiles/elastic-apm-agent-${elastic_apm_version}.jar</argument>
                                <argument>-Delastic.apm.service_name=${elastic_apm_service_name}</argument>
                                <argument>-Delastic.apm.environment=${elastic_apm_environment}</argument>
                                <argument>-Delastic.apm.server_urls=${elastic_apm_urls}</argument>
                                <argument>-Duser.language=en</argument>
                            </arguments>
                        </jMeterProcessJVMSettings>
                        <testFilesIncluded>
                            <jMeterTestFile>script1_add.jmx</jMeterTestFile>
                        </testFilesIncluded>
                        <logsDirectory>${project.build.directory}/jmeter/results</logsDirectory>
                        <generateReports>false</generateReports>
                        <testResultsTimestamp>false</testResultsTimestamp>
                        <resultsFileFormat>csv</resultsFileFormat>
                    </configuration>
                </plugin>
            </plugins>
        </build>
    </project>

    Usage Maven

    The maven groupId, artifactId and version, this plugin is in the Maven Central Repository Maven Central jmeter-elastic-apm

    <groupId>io.github.vdaburon</groupId>
    <artifactId>jmeter-elastic-apm</artifactId>
    <version>1.4</version>

    Advanced usage

    Change the XML extract file

    The action ADD of this tool is reading 3 XML files that contains extract of the XML JMeter script to add the 1) “User Defined Variables”, 2) “JSR223 groovy begin transaction apm” and 3) “JRS223 groovy end transaction apm”.

    This files are include in the tool jar file.

    You can change the XML files to include by indicating the path to the new XML files with the parameters -extract_udv or -extract_start or -extract_end

    You want to change the “JSR223 start transaction apm” with your own file.

    E.g. :

    java -jar jmeter-elastic-apm-<version>-jar-with-dependencies.jar -file_in script1.jmx -file_out script1_add.jmx -action ADD -regex SC.* -extract_start my_xml_file.xml
    

    You want to change all 3 files with yours XML files.

    E.g. :

    java -jar jmeter-elastic-apm-<version>-jar-with-dependencies.jar -file_in script1.jmx -file_out script1_add.jmx
    -action ADD -regex SC.* -extract_start my_xml_start_file.xml -extract_end my_xml_end_file.xml -extract_udv my_xml_udv_file.xml
    

    Another solution is to open the tool jar file with 7zip and replace the 3 files by yours files but keep the same XML file name and save the new jar.

    Reserved tags

    This tool is looking to reserved tags or special string in the XML extract files or in the JMeter script to REMOVE previously add JSR223 Samplers and User Defined Variables.

    This tags are :

    • In the “JSR223 groovy start transaction apm”, the reserved tags are : “@@TC_NAME” in the Parameters text field, this string will be replaced by the label of the following Transaction Controller and the “@@ELASTIC_APM_BEGIN” in the Comment text field
    • In the “JRS223 groovy end transaction apm”, the reserved tag is “@@ELASTIC_APM_END” in the Comment text field
    • In the “User Defined Variables”, the reserved tag is “@@ELASTIC_APM_UDV” in the Comment text field

    Call this tool likes a library

    To call this tool in an other tool, add the jar jmeter-elastic-apm-<version>-jar and this 2 libraries dependence (common-cli and org.slf4j) in the classpath and :

    import io.github.vdaburon.jmeter.elasticapmxml.ElasticApmJMeterManager;
    
    String sRegexTc = ".*";
    String sFileIn = "script1.jmx";
    String sFileOut = "script1_add.jmx";
    ElasticApmJMeterManager.modifyAddSamplerForElasticApm(sFileIn, sFileOut, ElasticApmJMeterManager.ACTION_ADD, sRegexTc, ElasticApmJMeterManager.EXTRACT_START_JSR223, ElasticApmJMeterManager.EXTRACT_END_JSR223, ElasticApmJMeterManager.EXTRACT_UDV_ELASTIC);
    

    Version

    Version 1.4 2025-01-14, Default property “param_apm_prefix” is now empty by default because you can’t remove it with empty value but easily add no empty value e.g: -Jparam_apm_prefix=TR_

    Version 1.3 2024-02-01, Change method name ELK to ELASTIC et file name tp extract_udv_elastic_under_testplan.jmx

    Version 1.2 2024-01-30, Change globally ELK to ELASTIC

    Version 1.1, 2024-01-10, Correct the class name in the uber jar and correct REMOVE result

    Version 1.0, first version of this tool.

    Visit original content creator repository https://github.com/vdaburon/jmeter-elastic-apm
  • kminion

    Prometheus Exporter for Apache Kafka – KMinion

    KMinion (previously known as Kafka Minion) is a feature-rich and flexible Prometheus Exporter to monitor your Apache Kafka cluster. All valuable information that are accessible via the Kafka protocol are supposed to be accessible using KMinion.

    🚀 Features

    • Kafka versions: Supports all Kafka versions v0.11+
    • Supported SASL mechanisms: plain, scram-sha-256/512, gssapi/kerberos
    • TLS support: TLS is supported, regardless whether you need mTLS, a custom CA, encrypted keys or just the trusted root certs
    • Consumer Group Lags: Number of messages a consumer group is lagging behind the latest offset
    • Log dir sizes: Metric for log dir sizes either grouped by broker or by topic
    • Broker info: Metric for each broker with its address, broker id, controller and rack id
    • Configurable granularity: Export metrics (e.g. consumer group lags) either per partition or per topic. Helps to reduce the number of exported metric series.
    • End to End Monitoring: Sends messages to its own topic and consumes them, measuring a messages real-world “roundtrip” latency. Also provides ack-latency and offset-commit-latency. More Info
    • Configurable targets: You can configure what topics or groups you’d like to export using regex expressions
    • Multiple config parsers: It’s possible to configure KMinion using YAML, Environment variables or a mix of both

    You can find a list of all exported metrics here: /docs/metrics.md

    Getting started

    🐳 Docker image

    All images will be built on each push to master or for every new release. You can find an overview of all available tags in our DockerHub repository.

    docker pull redpandadata/kminion:latest

    ☸ Helm chart

    A Helm chart will be maintained as part of Redpanda’s helm-charts repository.

    🔧 Configuration

    All options in KMinion can be configured via YAML or environment variables. Configuring some options via YAML and some via environment variables is also possible. Environment variables take precedence in this case. You can find the reference config with additional documentation in /docs/reference-config.yaml.

    If you want to use a YAML config file, specify the path to the config file by setting the env variable CONFIG_FILEPATH.

    📊 Grafana Dashboards

    I uploaded three separate Grafana dashboards that can be used as inspiration in order to create your own dashboards. Please take note that these dashboards might not immediately work for you due to different labeling in your Prometheus config.

    Cluster Dashboard: https://grafana.com/grafana/dashboards/14012

    Consumer Group Dashboard: https://grafana.com/grafana/dashboards/14014

    Topic Dashboard: https://grafana.com/grafana/dashboards/14013

    ⚡ Testing locally

    This repo contains a docker-compose file that you can run on your machine. It will spin up a Kafka & ZooKeeper cluster and starts KMinion on port 8080 which is exposed to your host machine:

    # 1. Clone this repo
    # 2. Browse to the repo's root directory and run:
    docker-compose up

    Chat with us

    We use Slack to communicate. If you are looking for more interactive discussions or support, you are invited to join our Slack server: https://redpanda.com/slack

    License

    KMinion is distributed under the MIT License.

    Visit original content creator repository https://github.com/redpanda-data/kminion
  • Eratosthenes

    Eratosthenes & other approaches to prime finding algorithms

    About this project

    Reading in one of my old study books I stumbled across the well-known sieve of Eratosthenes algorithm.

    As I had some spare time to study, I decided to see how I could implement this algorithm and other prime finding algorithms, and apply different approaches to these, among others using coroutines and RxJava.

    My goal was to see how they would behave and find out how they could be optimized (speed, memory, resources).
    It was never meant to be a mature production ready or life cycle friendly project.


    Clear winners

    • For not too high numbers: the classic Eratoshenes algorithm
      • Its simplicity and speed are unbeatable
      • Not feasible for really high numbers (say, above 300M) due to the high memory consumption (OutOfMemoryError)
    • For higher numbers: the try-divide implementation with concurrent coroutines
      • Fastest implementation for higher numbers
        • uses 100% CPU resources
        • still over 30 times slower than the classic Eratothenes algorithm
      • Low memory usage, able to crunch > 1G candidates without strain
      • Code much more complicated
        • less coherent, less intuitive, less maintainable

    Table of Contents


    Algorithm characteristics

    1. Sieve of Eratosthenes

    See https://en.wikipedia.org/wiki/Sieve_of_Eratosthenes.

    • A characteristic of the sieve of Eratosthenes is that it is not scalable to really high numbers (because you have to keep all previous primes in memory)
    • The basic algorithm is simple and straightforward

    2. Naive approach: Try divide

    In this approach, you just try to divide a number by all possible lower numbers, and if no one has a remainder of zero, you found a prime number

    • Compared to the Eratosthenes sieve, there is no need to keep previous results in memory
    • The basic algorithm is even more simple and straightforward

    Global optimizations

    There are some global optizations that are applied to all approaches:

    • Skipping even numbers above 2
    • Limiting the denominators to the square root of the candidate value
    Further optimizations?

    Several further optimizations are possible, but not applied:

    • Many described optimizations try to stochastically determine whether a number is not a prime and exclude these.
    • Other optimizations are more like determing the chance if something is (not) a prime
    • In the naive try divide algorithms a preparing step could be added to find the first primes up to, say, 1000, and use these as denominators instead of just “any” number in this range; higher denominators would just follow the baise try divide pattern

    No (unit) tests

    No unit tests or other tests are added. Each class file has a runnable main method.
    The goal was just to see what approaches and optimizations could be used with different techniques; not to create a mature production hardness & life cycle friendly project.

    Comparing approaches

    All implementated approaches produce all primes from 2 up to a given max (say, 100M).

    For the sieve of Eratosthenes this is in fact the only possible approach, as you can’t find a higher prime value until you found all previous ones.

    To allow comparison, I used the same approach for the “try divide” algorithms.
    This approach is fair if you wanted to find all primes from 2 up to a given number anyway; but a bit unfair in other use cases, e.g. “find all primes between 1000000 and 1000100” or just “is this number a prime?”; these use cases are not really usable with the sieve of Eratosthenes approach, but would fit well to the “try divide” approach.

    In other words, the naive “try divide” algorithm is more versatile and scalable (albeit slow), but for comparison it is pushed into the harness dictated by the “sieve of Eratosthenes” algoritm.

    Details

    Further details of the results can be found in the kdoc header of each class file.

    Memory usage

    • For the non-reactive approaches, the memory usage is determined statically during execution, and is output to the terminal.
    • This does not work well in reactive approaches (RxJava & coroutines). The same figures are output, but they do not reflect the real memory usage during execution.

      To do yet
      For this, external tooling should be used (e.g. Visual VM)

    Implemented approaches

    1. Sieve of Eratosthenes (implementations)

      1. The classic Eratosthenes approach

        • Computationally really cheap, so by far the fastest (primes up to 100M in less than 5s on my laptop)
        • Not scalable for seriously high numbers (say, above 250M), mainly because of memory usage
          • On my laptop / JVM it runs out of memory when finding primes higher than ~ 300M
        • Not very suitable to determine if just a single given number is a prime
      2. Two variations of the classic Eratosthenes approach

        • Optimized for using less memory (say, -30%)
          • Still, not scalable for seriously high numbers
        • Quite a bit slower than the classic approach (~ 7 times slower)
    2. Try divide (implementations)

      1. Just that, the naive approach

        • A lot slower than Eratosthenes
          • and much more so for higher numbers; say 60 to 100 times slower
        • No need to keep “previous” primes in memory, so usable for any number
        • Usable for any number up to the language limit (say, any Int or Long)
      2. Same, but keeping previous primes in memory as denominators

        • A bit slower(!) than the “simple” try divde approach (which uses all lower numbers as denominators), so what was meant as optimization rather appeared a change for worse.
          • Apperently iterating over and adding to the in-memory List takes more computation resources than the simple “just anything” naive try divide approach
      3. Parallel streams

        • No success, much much slower than the naive try divide approach, and consumes all available CPU resources
          • Some typical optimizations (early jumping out of a loop) are not possible within the parallel stream application
      4. RxJava

        • Try divide approach combined with RxJava
        • Not any faster than the naive try divide approach
        • But uses much less memory as results are not kept in memory but emitted on the fly
        • Slightly more complicated / less intuitive code than non-RxJava approach
        • So main benefit of using RxJava in this approach is low memory consumption compared to returning collection
      5. RxJava with parallelism

        • Slightly SLOWER than the non-parallel RxJava implementation
          • Different degrees of parallelism (say, 2 to >16) did not make much difference
          • Apparently the needed coordination of multiple threads takes more time than the theoretical benefit of running on mulitple threads / cores can compensate for.
      6. Kotlin coroutines using Flow

        • Try divide approach combined with coroutines / Flow
        • Comparable (speed, memory) with the RxJava solution
        • No more complicated than the non-coroutine approach; a bit simpler than with RxJava
        • So main benefit of using coroutines in this approach is low memory consumption compared to returning collection
      7. Kotlin coroutines using Channel

        • Try divide approach combined with coroutines / Channel
        • Speed comparable with the RxJava and coroutines / Flow solution
        • High memory consumption when using unlimited channel capacity (Channel.UNLIMITED) !!
          • On my laptop / JVM it runs out of memory after ~ 20 minutes when finding primes up to about 300M; so even more memory usage as the classic sieve of Eratosthenes approach.
          • Switching to other capacity settings than Channel.UNLIMITED drops the speed by a factor 100 or 1000, which makes these nearly unusable for this use case.

            To do yet
            Might be worthwhile to further investigate why this is the case…?

        • Anyhow, not a feasible approach, as it uses as many or more resources than anything else, without better performance
      8. Kotlin concurrent coroutines using Channel with fan-out / fan-in

        Fan out / fan in approach inspired by https://kotlinlang.org/docs/reference/coroutines/channels.html

        • The only approach to beat the naive try divide, about 4 times faster (on my 8-core laptop)
          • But still way slower than the classic Eratothenes algorithm (over 6.5 minute for 300M candidates, Eratosthenes algorithm does that in 12.3 s, so more than 30 times slower than the Eratosthenes sieve)
        • Low memory consumption
          • The only one to crunch 1G candidates in a somewhat feasible timespan (37 minutes)
            • Other approaches are either way slower or crash with OutOfMemoryError for anything above ~ 300M candidates.
        • At the downside, the code is much more complicated, less intuitive, harder to maintain
          • Architecturally: less coherent, more internal coupling

    Some conclusions

    • Coroutines and RxJava reduce memory usage as primes can be produced and consumed concurrently.

      Part of this can also be achieved by using Sequence instead of Collection.

    • Running RxJava with parallel option does not offer any benefit for this use case, neither in speed nor in memory, while consuming all CPU resources
    • Concurrent coroutines (fan out / fan in approach) give a nice performance boost
      • but much more complicated / less coherent code
      • consumes all CPU resources
      • scalable, does not run out of memory on high counts

      For not too high candidate counts, the classic sieve of Eratosthenes algorithm is still unbeatable

    • Non-concurrent coroutines and non-parallel RxJava reduce memory usage, but do not improve speed

    Visit original content creator repository
    https://github.com/JanHendrikVanHeusden/Eratosthenes